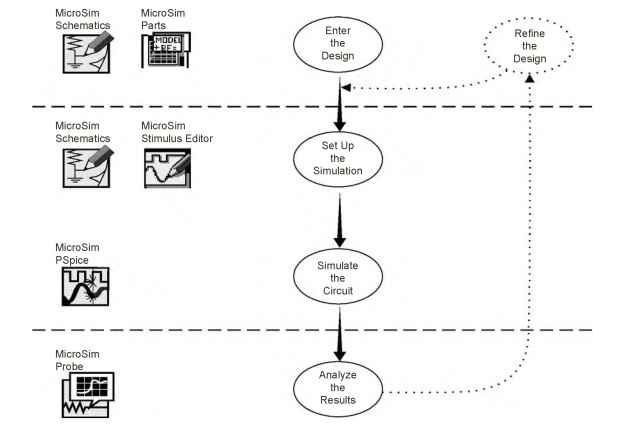
Simulation studies of power electronic circuits with PSPICE are very simple to conduct. They basically consist of three steps [4] as shown in this figure: (1) creation of circuit schematic, (2) simulation, and (3) graphical plotting of the results. The programs required in these steps are shown in the figure. The schematic is created with the help of schematics and parts programs. The parts, such as voltage and current sources, resistors, capacitors, op amps, and gates, and power devices, such as diodes, power MOSFETs, and IGBTs, are brought in from the parts library with their symbols, attributes, and models and then interconnected to generate the complete schematic. The schematic is debugged for possible errors. Then, a simulation command is used to start the simulation using PSPICE. The Stimulus Editor is a graphical input waveform editor that generates the time-domain waves to test the circuit's response during simulation. Finally, when the analysis results are generated, the Probe software plots the waveforms from the output data. The waveforms help to refine the circuit design as shown until satisfactory waveforms are obtained from the optimized circuit design.